Smart Publish is an easy-to-use tool that guides non-technical users step-by-step through the process of building analytical content using augmentation engines and heuristics. This tool offers users the simplest method for building data visuals in Pyramid using a simple point-and-click wizard.
The result of running this tool is that a new publication is created from scratch with a one-off discovery embedded on its first page.
Tip: If you already have a publication, you can add a new discovery using Smart Reporting by selecting the Smart Reporting option in the Toolbox. For details, see Creating Visuals using Smart Reporting in Publish Pro or Creating Visuals using Smart Reporting (Publish Lite).
Smart Publish
Opening the Smart Publish wizard
You may be able to select Smart Publish from your Pyramid Home Page or from the Quick Start panel:
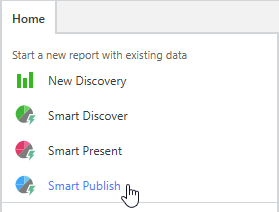
Note: This option will typically be available from the New Report panel of your home page, although your Home Page is fully configurable and may not include any Smart links.
Selecting your data model
Select the data model that contains your data. You can select a model from your Recent or Favorites views or navigate through the Explorer view to your model.
For detailed steps describing this process, see Opening a data model in the Discover section of this help file.
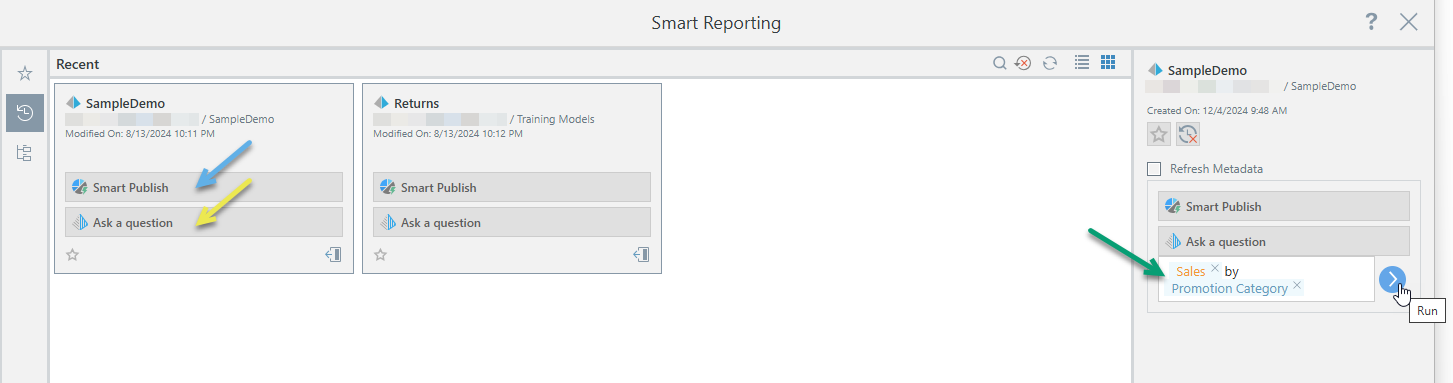
Tip: For your data model, you can select one of the following options:
- Smart Publish (blue arrow) opens Smart Reporting.
- Ask a Question (yellow arrow below) opens Smart Reporting, builds an initial visual, and opens the Chatbot. You should use this option if you know what you would like to add to your visual and want to describe that using natural language (green arrow).
Building or editing your visual
After you have opened the Smart Reporting tool, you may need to either build your visual from scratch or, optionally, edit the visual that was created by the Chatbot. In either case, you need to click Finish to indicate that you are happy with your visual and to add it to your publication.
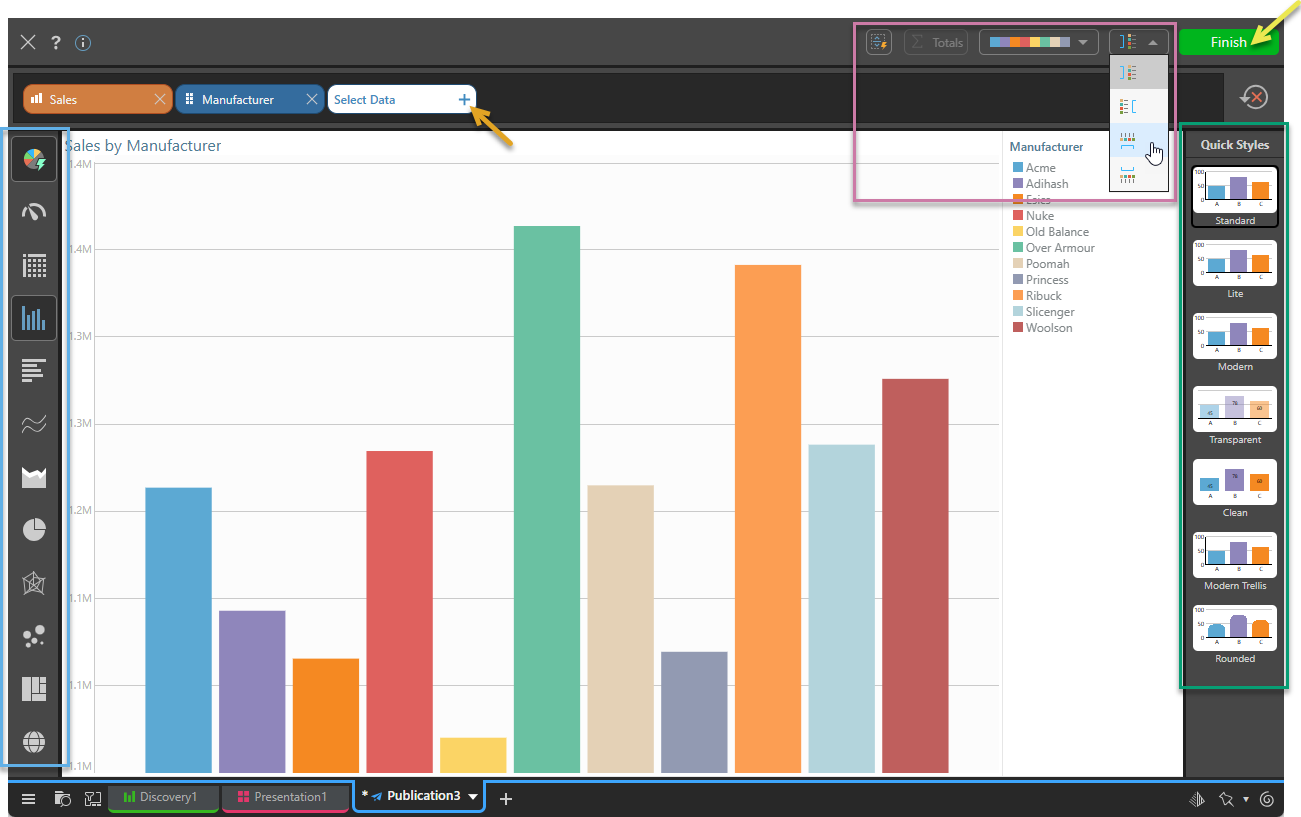
From the Smart Reporting window:
- Click Select Data + to open the data selection panel and then add each measure (quantitative data), hierarchy (qualitative data), or filter to your visual. Note that each time you make a selection, a chip is added to the header above the canvas and the visual is redrawn to reflect your additional selection.
- The first time you access this panel, you can only add Values (also called Measures). Note: You can select any Custom Measures that you have access to from the Custom Measures folder at the bottom of the Values tree. The behavior is the same as for standard measures.
- Subsequently, you can add additional Values, Dimensions, or Filters. Note: You can select any Custom Members that you have access to when you make a Custom Selection in the Dimensions and Filters flyout panels.
- Click here for the help materials for Smart Reporting.
- Optionally, change the Visualization Type (blue highlight), Design (Theme and Item-Specific settings, purple highlight), or Quick Styles used by your visual (green highlight).
- Once you have built your visual, click Finish (yellow arrow).
For an overview of the Smart Reporting tool, see:
Once your visual is created, you will be able to change these settings at any time. Use the Open in Discover option on the right-click context menu to open it from your publication.
Tip: If you are not happy with your visual, you can click Close ("X") at any time to close Smart Reporting without saving.
Pyramid creates the visual and drops it onto your publication.
Note: By default, Smart discoveries are "one-off" content items that only exist in the current publication; they cannot be re-used by your colleagues or in other publications unless you save them to the CMS using the right-click Make Shareable option.
What next?
Once you have added your visual, you might want to:
- Resize your visual: Select the panel and drag its handles to fit the space.
- Rename your visual: Right-click the panel, select Rename Title, and supply a new title.
You might also want to add additional content items to the canvas, including additional visuals, text, shapes, images, and so on.
Other tools
You might want to open your visual in Discover to update it. You can do this using the Open in Discover option on the right-click context menu.